
Horizontal Bar Graphs in HTML
by David Halls
Introduction
So far, we have been trying to demonstrate how, using HTML and VBScript in Internet Explorer, we can get much of the functionality of programs written in Visual Basic. Along the way, some advantages of this approach have become apparent. The programs are very compact. Most of the overhead found in Visual Basic programs is not necessary here as the engine behind these compact programs is built into Internet Explorer which is likely to be on any computer with Windows as the operating system. The use of these programs in handling databases, presenting data and editing and producing documents has been demonstrated. So far, the topic of graphics has not been explored. This project is about presenting data as a bar graph and will use HTML components for presentation.
Basic Principles
In this graph, the axes will be formed from the borders of a table cell and the bars will be horizontal rules. The horizontal rule, <hr />, has three useful properties, color, width and size. The width is the horizontal length in pixels and will be programmed to be proportional to the mean temperature. The size is the line height in pixels and can be adjusted so that the bars line up with the month captions on the vertical axis. We will assume that we know the range of values of temperature to plot so that the x-axis can be set up. The cell forming the graph is 400 px wide, but actually spans four cells ("colspan=4"), each with a width of 100 px. The next row uses the cells individually, each with a border on the right to give the markers for the axis. Thus, 100 px represents 5 oC.
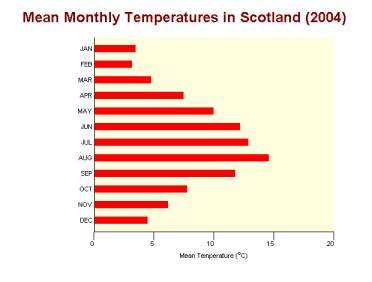
The data was taken from a text file on a Met Office website, which listed monthly mean temperatures in Scotland since 1961. The 2004 data was copied into a new text file and the heading line of months copied also. The resulting file contents are shown below:
JAN    FEB    MAR    APR    MAY    JUN    JUL    AUG    SEP    OCT    NOV    DEC
3.4    3.1    4.7    7.4    9.9   12.1   12.8   14.5   11.7    7.7    6.1    4.4
Reading the data
We use the FileSystemObject to read the two lines of data and the function, split, to read the data into an array. Split requires two parameters, the expression to be split and the characters separating the individual items (in this case three spaces). These arrays created by the split function are strange and caused me problems. They must be declared as a variable without dimensions and used initially in the same way. Once created, the data can be accessed by putting in the dimension.
datafilename = "C:\html progs\2004temp.txt"
dim monthdata, tempdata

sub getdata
Dim filesys, readstream, readtext
Set filesys= CreateObject("Scripting.FileSystemObject")
Set readstream = filesys.OpenTextFile(datafilename,1)
readtext = readstream.ReadLine
monthdata = split(readtext, "   ")
readtext = readstream.ReadLine
tempdata = split(readtext, "   ")
set filesys = nothing
set readstream = nothing
end sub
Setting up the table to form the graph
The structure of the table was explained above and can now be seen in the code below. The default style for the element <td> is set in the style sheet to align right, so that the month captions and temperature values on the x-axis align to the right of their cells. In the first cell of the first row, the procedure getdata described above is called to retrieve the data from the file. A second procedure, monthtitles, is called which is described later. This sets up the month titles for the bars. The right column of that row forms the main part of the graph and calls a procedure called bars to set up the horizontal bars. The next row sets up the markers on the x-axis with the following row adding the temperature values. The final row spans the 4 cells under the graph to set the axis title.
<body><center>
<h1 align = "center">Mean Monthly Temperatures in Scotland (2004)</h1>
<table align = "center" cellspacing="0" cellpadding="0" width="500px" border="0"
bgcolor = "white">
<tr>
<td width = "100px" valign = "middle" >
<script language="VBScript" type="text/vbscript">
<!--
call getdata
call monthtitles
//-->
</script>
</td>
<td colspan = "4" width = "400px" style = "background-color:lightyellow;
border-left: 1px solid black; border-bottom: 1px solid black;
text-align:left;">
<script language="VBScript" type="text/vbscript">
<!--
call bars
//-->
</script>
</td>
</tr>
<tr>
<td style = "border-right: 1px solid black;width:100px;"> </td>
<td style = "border-right: 1px solid black;width:100px;"> </td>
<td style = "border-right: 1px solid black;width:100px;"> </td>
<td style = "border-right: 1px solid black;width:100px;"> </td>
<td style = "border-right: 1px solid black;width:100px;"> </td>
</tr>
<tr>
<td>0</td>
<td>5</td>
<td>10</td>
<td>15</td>
<td>20</td>
</tr>
<tr>
<td> </td>
<td height = "20" colspan = "4" style= "text-align:center;">
Mean Temperature (<sup>o</sup>C) <br /></td>
</tr>
</table>
</center>
</body>
Procedures for the bars and bar titles
The length of the bar, i.e. the width of a horizontal rule, is set as the temperature value multiplied by the factor 400/20 to convert it into pixels to fit the scale.
The procedure, monthtitles, iterates through the monthdata, writing the months as a column in the left cell of the first row of the table. A little adjustment was found necessary to make the text lines align with the bars. The font size of 8 pt for the months with a break between each title will line up with the bars if the 'size' of the bars is set to 12 px.
sub bars
for  i = 0 to  11
	 barwidth(i) = tempdata(i)*400/20
	 document.write "<hr width = '"& barwidth(i) &"' color = 'red' size = '12'/>"
next
end sub

sub monthtitles
document.write "<br />"
for i = 0 to 11
	document.write  monthdata(i) & " <br /><br />"
next
end sub
Conclusions
Well, there we have it! A compact program of 2.5 KB capable of drawing a bar graph from a data file. The program could be developed further with an interface to take information from the user on the data source file, title, axes, etc.
To see the program working, click here. In this version to work on the web, the data has been hard-coded into arrays so that an external file is not required. As it uses VBScript, browsers other than Internet Explorer will not like it. The source code can be viewed; the original code retrieving data from an external file is still there but has been commented out.