
Vertical Bar Graphs in HTML Part 2
by David Halls
In Part 1, the code to display vertical bar graphs was developed, but there was a need for a way of expressing the scale of the bars. This article shows various ways of adding to the basic vertical bar graph to indicate scale.
Putting the values on the bars
This is the simplest way of expressing scale and only requires a small modification to the code.
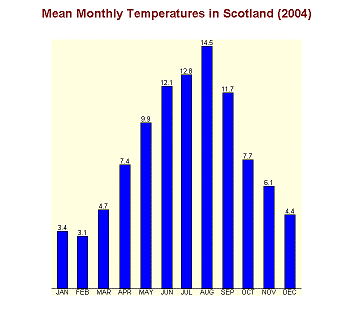
This is the codeline required to produce the bars with the values:
document.write "<td valign = 'bottom' style = 'border-bottom: 1px solid black;'>" & tempdata(i) & "<br />_
			   <img src = 'blue.gif' width='" & colwidth & "' height = '" & barheight & "'_
			   border = '1' ></td>"
Adding a y-axis
To add an axis and put the maximum value at the top, two extra columns are required. The first is for the title of the axis which is vertically aligned in the middle of the cell. The second is for the maximum value, scaleheight which is aligned at the top of the cell. Borders on the right and top of the cell give the axis and marker point, respectively.
Remember to add two extra blank columns to the second row, otherwise the alignment will be out.
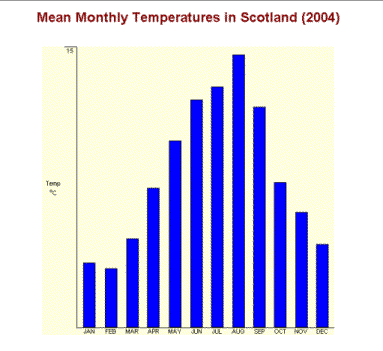
The drawgraph subroutine now becomes:
sub drawgraph dim barheight 'set up table document.write "<table align = 'center' cellspacing = '0' cellpadding= '0' _ width='" & numcols*colwidth & "' border = '0' bgcolor = 'lightyellow'>" document.write "<tr>" 'column for title of axis document.write "<td valign = 'middle'>Temp <br /><sup>o</sup>C</td>" 'column for maximum value - borders give axis and mark point document.write "<td valign = 'top' style = 'border-right: 1px solid black;border-top: 1px solid black;'_ width = '20'>" & scaleheight & "</td>" 'first blank column document.write "<td valign = 'bottom' width = '500' style = 'border-bottom: 1px solid black;'> </td>" for i = 0 to numbars-1 ' scale bar height to value of mean temperature barheight = 500*tempdata(i)/scaleheight document.write "<td valign = 'bottom' style = 'border-bottom: 1px solid black;'>_ <img src = 'blue.gif' width='" & colwidth & "' height = '" & barheight & "'_ border = '1' ></td>" document.write "<td valign = 'bottom' style = 'border-bottom: 1px solid black;'> </td>" next document.write "</tr>" ' write column names in next row document.write "<tr>" 'add two extra blank cells document.write "<td> </td>" document.write "<td> </td>" document.write "<td> </td>" for i = 0 to numbars-1 document.write "<td>" & monthdata(i)& "</td>" document.write "<td> </td>" next document.write "</tr></table>" end sub
Adding scalepoints to a y-axis
The last example is the most complicated, as to achieve the effect, we have to divide the main row in the layout table into as many rows as scalepoints are required.
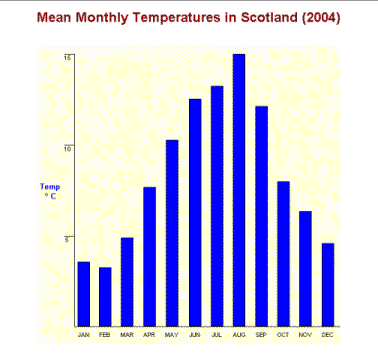
A new variable, scaleunit, is defined which as the name suggests is the unit for each scalemarker. The number of rows required to give the scalemarkers is called vmarks which is the scaleheight divided by the scaleunit.
The notes in the code should help explain the changes in the code to achieve this scaling.
<script language="VBScript" type="text/vbscript">
dim monthdata, tempdata,numbars, numcols, colwidth, colheight, scaleheight, scaleunit, vmarks
monthdata = array("JAN","FEB", "MAR", "APR", "MAY", "JUN", "JUL", "AUG", "SEP", "OCT", "NOV", "DEC")
tempdata = array (3.4, 3.1, 4.7, 7.4, 9.9, 12.1, 12.8, 14.5, 11.7, 7.7, 6.1, 4.4)
scaleheight = 1
scaleunit = 5
vmarks = scaleheight/scaleunit
numbars = Ubound(monthdata)+1
numcols = numbars*2 + 1
colwidth = 20
sub drawgraph
document.write "<table align = 'center' cellspacing='0' cellpadding='0' width=" & (numcols +2)*colwidth_
& " border = '0' bgcolor = 'lightyellow'>"
'first row blank to give space
document.write "<tr>"
document.write "<td colspan = '" & (numcols + 2) & "'> </td></tr><tr>"
'column to give title to axis - rowspan equal to the the number of vmarks
document.write "<td rowspan = '" & vmarks & "'valign = 'middle' width = '50' height = '500'>_
<p class = 'axistext'>Temp<br /> <sup>o</sup> C</p></td>"
'column to give axis and top marker of scaleheight - rowspan equal to the the number of vmarks
document.write "<td valign = 'top' style = 'border-right: 1px solid black;border-top: 1px solid black;' width = '10'>_
" & scaleheight &"</td>"
'draw bars with a rowspan equal to the the number of vmarks
for i = 0 to numbars-1
colheight = 500*tempdata(i)/scaleheight
document.write "<td rowspan = '" & vmarks & "'valign = 'bottom' style = 'border-bottom: 1px solid black;'>_
<img src='blue.gif' width='" & colwidth & "' height='" & colheight & "' border='1' ></td>"
document.write "<td rowspan = '" & vmarks & "'valign = 'bottom' style = 'border-bottom: 1px solid black;'>_
</td>"
next
document.write "</tr>"
'fill in the remaining markers on the axis
for i = (vmarks -1) to 1 step -1
document.write "<tr><td valign = 'top' style = 'border-top: 1px solid black;border-right: 1px solid black;'_
width = '10'> " & scaleunit*i & "</td></tr>"
next
'write column names in next row
document.write "<tr><td> </td>"
document.write "<td> </td>"
document.write "<td> </td>"
for i = 0 to numbars-1
document.write "<td>" & monthdata(i)& "</td>"
document.write "<td> </td>"
next
document.write "</table>"
end sub
</script>
Conclusion
This article has shown how it is possible to draw a vertical bar graph from data using a combination of HTML and VBScript. Various solutions have been given to the problem of indicating the scale of the vertical axis.
If a previous article is followed, it is possible to adapt the code to import data from an external file to plot the graph. This approach further illustrates how useful the combination of VBScript and HTML is in constructing standalone programs running under Internet Explorer.